Once again I found myself creating images for my new Decoded Science article, "From the Cartesian Plane to the Areas of Rectangles and Triangles".
A Simple Graph on the Plane
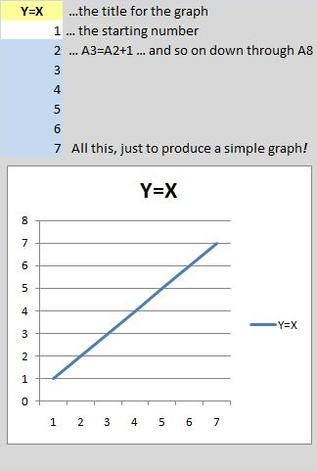
"Simple Graph in the Cartesian Plane" by Mike DeHaan
This first image is an extremely simple graph plotted by Excel. I simply needed a straight line, plotting Y=X, to illustrate the Cartesian plane.
Or was it so "simple"?
Or was it so "simple"?
After Doctoring the Image...
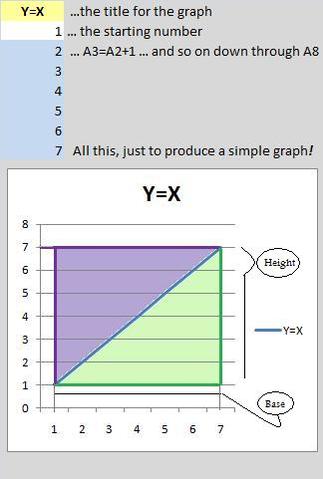
This second image allows me to easily show the area of a square cut along the diagonal by my Y=X plot.
Is it obvious that I used Microsoft Paint to doctor the first image?
Is it obvious that I used Microsoft Paint to doctor the first image?
Article Self-Promotion
As always, I will also promote this Decoded Science article in my DeHaan Services blog. This time, the blog post is "Simple Area Calculations in the Cartesian Plane".
Writing Tip: Multiply Your Images by Modifying Them
My goal was to calculate the "area" of a simple figure in the Cartesian plane. The first image simply showed the plane, since I had to ensure my readers would know that term.
However, I knew from the start that I needed a second image for the "area". So I developed that second image, stopping long enough to record the first one from the work in progress.
Writing Tip: Whether you are writing text or creating images, plan ahead so you can make use of everything you do. Show your readers the stages an image goes through, if that helps to present your message.

 RSS Feed